В этой статье я поделюсь личным опытом: рецептом создания объектов и анимаций. Вместе мы создадим обучающее видео о гистограммах. Вот как будет выглядеть итоговый вариант:

А теперь поехали!
Для начала установим пакеты LaTeX и FFmpeg в систему — они нужны для рендера видео и текста (все операции производятся в macOS Big Sur). Для установки LaTeX перейдём на сайт www.tug.org/mactex, скачаем и установим пакет в систему. Есть и более каноничный вариант — использовать Brew и сразу установить оба пакета, как и написано в Readme репозитория:
> brew install ffmpeg mactex
Важно! Иногда после установки Manim отказывается рендерить видео, в которых есть русский текст (возможно, это особенности MacOS). Сначала я грешил на неправильную установку LaTeX, так как ошибка указывала именно на него, но дело оказалось в другом. Объясню ниже.
Собирать и запускать проект будем по-модному — через Poetry.
> poetry new habr_manim
> cd habr_manim
> poetry add manimlib
> touch main.py
> mkdir classes
Для создания видео нам потребуются:
В нашем примере новым объектом будет только текст, так как для применения собственного шрифта стандартный класс необходимо перегрузить, добавив переменную класса CONFIG. Остальные элементы — стандартные классы из Manim.
Создадим файл histogram_text.py со следующим содержимым:
classes/histogram_text.py
Для создания шариков используем элемент библиотеки Dot, который принимает кучу разных параметров. Нам нужны следующие:
Полный вариант кода будет ниже, а пока опишу основные методы и классы, которые нам пригодятся:
Создадим в корне проекта файл scenario.py, в котором опишем основные сценарии для разных анимаций. Код в этом файле будет похож на действительный сценарий (обратите внимание на метод play_whole_scenario() — яркий пример такой реализации), а всю остальную логику спрячем в классы-объекты сцены. Начнём с самого простого — приветственной видеозаставки «Гистограммы».
scenario.py
from manimlib.imports import MovingCameraScene, Dot, VGroup, BLACK, FadeIn, FadeOut
from numpy import array
from random import randint
from classes import HistogramText
class Scenario:
def __init__(self, scene: Scene):
"""Main scenario class initialization.
Args:
scene (Scene): Instance of the Scene class.
"""
self.scene = scene
def play_first_scene(self):
# We are creating list for storing dots
dots = []
# Columns with dots will be placed one after another, so X position
# will be calculated automatically
start_x = -4
# Dot size
point_radius = 0.3
for _ in range(5):
# Dots inside columns will be placed one above the other, so Y position
# will be calculated automatically
start_y = -2
for _ in range(randint(2, 6)):
dots.append(
Dot(
point=array([start_x, start_y, 0]), # Coordinates on the screen, assigned with x,y,z
radius=point_radius, # Dot size
stroke_width=1, # Border width
stroke_color=BLACK, # Border color
color="#7fcc81", # Dot color
)
)
start_y += 0.7
start_x += 2
# Grouping dots into VGroup that is the Scene's element
dots = VGroup(*dots)
# Adding dots to the scene
self.scene.add(dots)
# Creating text. We are using our own Overridden class.
heading = HistogramText("Гистограммы", color=BLACK)
# Changin text size with scale
heading.scale(2)
# Changing text location
heading.move_to(array([0, 2.5, 0]))
# Playing animation for the text appearing
self.scene.play(FadeIn(heading))
# Waiting
self.scene.wait(2)
# Playing animation for the text disappearing
self.scene.play(FadeOut(dots), FadeOut(heading))
# Waiting
self.scene.wait(1)
Все файлы готовы. Чтобы запуститься, нам осталось лишь донастроить приложение, вызвав из main.py сценарий.
Класс MainScene отвечает за запуск приложения. Для запуска рендера видео этот класс обязательно должен наследоваться от CameraScene (мы будем наследоваться от MovingCameraScene, так как для дальнейшей разработки понадобятся методы перемещения камеры, которых нет в стандартной CameraScene). В нашем классе объявлена переменная CONFIG, в которую можно добавить настройки сцены. Метод construct — точка входа в приложение. Вот как это выглядит в коде:
main.py
import os
from pathlib import Path
# We are importing MovingCamera, instead of CameraScene to be able to
# move the camera around.
from manimlib.imports import MovingCameraScene
from config import SCENE_BACKGROUND_COLOR
from scenario import Scenario
# Adding flags to build animation.
# -l (low quality)
# -s (only screenshot)
RESOLUTION = ""
FLAGS = f"-pl {RESOLUTION}"
SCENE = "MainScene"
class MainScene(MovingCameraScene):
# Scene background is black by default, to change it we need to
# override CONFIG dictionary.
CONFIG = {
"camera_config": {
"background_color": SCENE_BACKGROUND_COLOR,
},
}
def construct(self):
"""Construct method - enter point to create animation"""
hist = Scenario(self)
hist.play_first_scene()
if __name__ == "__main__":
script_name = Path(__file__).resolve()
os.system(f"manim {script_name} {SCENE} {FLAGS}")
Итоговая структура проекта получилась такой:
classes/
__init__.py
histogram_text.py
main.py
scenario.py
pyproject.toml
Приложение готово к первому запуску. Изменим pyproject.toml, добавив директорию packages с нашими классами и соберём проект:
> vi pyproject.toml
[tool.poetry]
...
packages = [
{ include = "classes" }
]
> poetry build
> poetry install
> poetry run python main.py
Первая анимация готова!
Что делать, если вы столкнулись с проблемой рендеринга русского текста? Рассказываю:
> poetry env info
Копируем путь к venv, он будет выглядеть примерно так: ~/Library/Caches/pypoetry/virtualenvs/habr-manim-jyKtqU_G-py3.7
Находим файл tex_template.tex в виртуальном окружении и редактируем его:
> vi ~/Library/Caches/pypoetry/virtualenvs/habr-manim-jyKtqU_G-py3.7/lib/python3.7/site-packages/manimlib/tex_template.tex
Сверяемся, чтобы содержимое было следующего вида:
\documentclass[preview]{standalone}
\usepackage[english]{babel}
\usepackage[utf8]{inputenc}
\usepackage[T1]{fontenc}
\usepackage{amsmath}
\usepackage{amssymb}
\usepackage{dsfont}
\usepackage{setspace}
\usepackage{tipa}
\usepackage{relsize}
\usepackage{textcomp}
\usepackage{mathrsfs}
\usepackage{calligra}
\usepackage{wasysym}
\usepackage{ragged2e}
\usepackage{physics}
\usepackage{xcolor}
\usepackage{microtype}
\DisableLigatures{encoding = *, family = * }
%\usepackage[UTF8]{ctex}
\linespread{1}
\begin{document}
YourTextHere
\end{document}
Сохраняем файл. Теперь русский текст будет отображаться нормально.
Итого мы сделали каркас для приложения, настроили его к запуску, переопределили стандартный класс текста, чтобы применить собственный шрифт, и создали видео для вступления. Но дальше — больше. Будем строить график, таблицу, воронку и шарики.
Дисклеймер! Противникам ООП после прочтения может стать плохо. Сначала определим сценарий и объекты, необходимые для его реализации:
Сценарий 1
Сценарий 2
Исходя из этих сценариев, нам понадобятся следующие объекты:
Начнём с самого простого. В директорию classes добавим новый файл — histogram_dot.py, в котором определим класс для шарика. Код ниже под спойлером, но ключевые моменты объясню тут:
classes/histogram_dot.py
from typing import Dict, Union
from colour import Color
from manimlib.imports import BLACK, WHITE, Dot, VGroup
from numpy import ndarray
from .histogram_text import HistogramText
from .shape_point import ShapePoint
class HistogramDot(VGroup):
"""This class contains Dot, Text and all needed info that we want, such as 'value'"""
colors: Dict[int, str] = {
1: "#7FCC81", # green
2: "#FFE236", # yellow
3: "#FFB742", # orange
4: "#FF7555", # red
}
dot_scale_float: Union[int, float] = 0.25
dot_scale_int: Union[int, float] = 0.4
radius: Union[int, float] = 0.2
def __init__(
self,
value: int,
point: ndarray,
radius: float = None,
color: Color = None,
):
"""Class initialization.
Args:
value (int): Text of the dot.
point (array): Location on the screen.
radius (float, optional): Dot radius. Defaults to None.
color (Color, optional): Dot color. Defaults to None.
"""
self.value = value
self.radius = radius or self.radius
if not color:
color = self.colors.get(value, WHITE)
dot = Dot(
point=point,
radius=self.radius,
color=color,
stroke_color=BLACK,
stroke_width=1,
)
text = HistogramText(str(self.value), color=BLACK)
self.point = ShapePoint(point)
# We are changing the text size to be able to add it inside a d
if isinstance(self.value, float):
text.scale(self.dot_scale_float)
else:
text.scale(self.dot_scale_int)
# Moving text inside a dot
text.move_to(dot.get_center())
super().__init__(dot, text)
def __repr__(self):
return f"{self.__class__.__name__}({self.value}, {self.point}, {self.radius}, {self.color})"
Теперь напишем класс для построения таблицы и добавим в него возможность настройки размеров и параметров. В рамках нашей задачи удобство и универсальность важнее, чем single-responsibility principle. Поэтому мы сделаем так, чтобы построение таблицы вызывалось одним методом и работало максимально просто. Сама таблица в этом случае тоже является объектом VGroup и состоит из кучи линий, текста и шариков.
Чтобы не запутаться, разделим таблицу на обычную (класс Table, состоящий из линий) и таблицу покупателей (она наследует Table и дополняет линии текстом и шариками). В процессе построения на вход подаются кортежи с координатами, их валидацию мы выносим в отдельный класс-helper ShapePoint. Он будет валидировать и обозначать координаты точек на плоскости.
classes/shape_point.py
from typing import Tuple, Union
from numpy import array, ndarray
class ShapePointException(Exception):
pass
class ShapePointTypeError(ShapePointException):
pass
class ShapePointTooManyValuesException(ShapePointException):
pass
class ShapePoint:
"""Class for validation and storing information about screen points"""
_coords: ndarray
def __init__(self, coords: Tuple[Union[int, float], Union[int, float]]):
self.coords = coords
@property
def coords(self):
return self._coords
@coords.setter
def coords(self, value: Tuple[Union[int, float], Union[int, float]]):
"""Method -setter for validation and storing coordinates.
Args:
value (Tuple[Union[int, float], Union[int, float]]): tuple with coordinates
Raises:
ShapePointTypeError: Wrong data type was passed.
ShapePointTooManyValuesException: You put too many variables inside tuple.
ShapePointTypeError: Data inside tuple is in the wrong format.
"""
if not isinstance(value, Tuple) and not isinstance(value, ndarray):
detail = f"Coords must be a type of: [tuple, np.ndarray], got [{type(value)}] instead."
raise ShapePointTypeError(detail)
if isinstance(value, ndarray):
value = value[:2]
if len(value) != 2:
detail = "Coords must contain 2 values"
raise ShapePointTooManyValuesException(detail)
for coord in value:
if not isinstance(coord, int) and not isinstance(coord, float):
detail = f"Values in coords must be a type of: [int, float], got [{coord}:{type(coord)}] instead."
raise ShapePointTypeError(detail)
self._coords = array([value[0], value[1], 0])
def __getitem__(self, item):
return self.coords[item]
def __repr__(self):
return f"{self.__class__.__name__}({self.coords})"
Алгоритм построения базовой таблицы (класс Table) простой: задаём координаты первой линии, количество строк, высоту строк, количество колонок, ширину колонок и количество строк, которое будет видно. Отрисовка каждого элемента на экране занимает время и память, соответственно, в таблице, где видно всего 10 строк из 100, нет смысла рисовать ещё 90. Также задаём цвет и ширину границы. Затем для каждой строки добавляем горизонтальную линию и столько вертикальных линий, сколько у нас колонок. В итоге получаем набор VGroup из линий, который и является таблицей.
Построить таблицу для покупателей (CustomerTable) тоже просто: наследуемся от базового класса и добавляем на каждую строчку текст и шарик. Чтобы числа всегда получались одинаковыми, и не было необходимости вручную вводить кучу значений, в класс CustomerTable добавлен параметр start_dot_values, в который можно добавить именно те значения, о которых говорится в описании таблицы. Все остальные значения генерируются с помощью random.seed() (это псевдорандом, то есть Python генерирует одни и те же числа каждый раз, когда запускаешь проект). Таким образом, запустив скрипт 500 раз, мы получим 500 одинаковых «рандомных» значений (люблю питончик).
Файл таблицы выглядит следующим образом:
classes/table.py
import random
from typing import Tuple, Union
from colour import Color
from manimlib.imports import BLACK, LEFT_SIDE, Line, VGroup
from numpy import array
from .histogram_dot import HistogramDot
from .histogram_text import HistogramText
from .shape_point import ShapePoint
class TableException(Exception):
pass
class TableLineEmptyException(TableException):
pass
class Table(VGroup):
"""Table class. Built from Lines"""
def __init__(
self,
start_end_points: Tuple[tuple, tuple],
row_count: int = 0,
row_height: Union[int, float] = 0.2,
column_count: int = 0,
visible_row_count: int = 0,
columns_width: tuple = None,
lines_color: Color = BLACK,
stroke_width: Union[int, float] = 1,
*args,
**kwargs,
):
"""Class initialization.
Args:
start_end_points (Tuple[tuple, tuple]): Left top and right top points. ((x1,y1), (x2,y2)).
row_count (int, optional): Table row count. Defaults to 0.
row_height (Union[int, float], optional): Table row height. Defaults to 0.2.
column_count (int, optional): Table column count. Defaults to 0.
visible_row_count (int, optional): Table visible row count. Defaults to 0.
columns_width (tuple, optional): Table column width. For 3 columns it looks like
(.4, .4, .2). Defaults to None.
lines_color (Color, optional): Table lines color. Defaults to BLACK.
stroke_width (Union[int, float], optional): Table lines width. Defaults to 1.
Raises:
TableLineEmptyException: Raises when no start_end_points were passed.
"""
if not start_end_points:
detail = "Can't create a graph with the empty start line."
raise TableLineEmptyException(detail)
if columns_width:
assert (
len(columns_width) == column_count
), "Columns count and list with their widths must be the same length."
self.horizontal_line = [
ShapePoint(start_end_points[0]),
ShapePoint(start_end_points[1]),
]
self.row_count = row_count
self.row_height = row_height
self.column_count = column_count
self.visible_row_count = visible_row_count
self.columns_width = columns_width
self.lines_color = lines_color
self.stroke_width = stroke_width
self.lines = self._create_table()
super().__init__(*self.lines, *args, **kwargs)
def _create_table(self) -> VGroup:
"""Method for creating tables.
Returns:
VGroup: Object made from the list of lines (Line).
"""
lines = []
y_point = self.horizontal_line[0][1]
y_step = self.row_height
x_left_point = self.horizontal_line[0][0]
x_right_point = self.horizontal_line[1][0]
distance = abs(x_right_point - x_left_point)
# Drawing table
for i in range(self.row_count + 1):
# Adding horizontal line
lines.append(
Line(
array([x_left_point, y_point, 0]),
array([x_right_point, y_point, 0]),
color=self.lines_color,
stroke_width=self.stroke_width,
)
)
if i == self.row_count:
break
# Adding vertical lines
x_point = x_left_point
for j in range(self.column_count + 1):
lines.append(
Line(
array([x_point, y_point, 0]),
array([x_point, y_point - y_step, 0]),
color=self.lines_color,
stroke_width=self.stroke_width,
)
)
if j == self.column_count:
break
if self.columns_width:
temp_step = self.columns_width[j]
assert isinstance(temp_step, float), "Column width must be a float value"
assert 0 < temp_step <= 1, "Column width must be in range [0 < column_width <= 1]"
x_point = x_point + (distance * temp_step)
else:
x_point = x_point + (distance / self.column_count)
y_point -= y_step
lines = VGroup(*lines)
return lines
class CustomersTable(Table):
"""Overridden Table class. Custom text and dots were added."""
def __init__(
self,
start_end_points: Tuple[tuple, tuple],
row_count: int = 0,
row_height: Union[int, float] = 0.5,
visible_row_count: int = 0,
colors: list = None,
bins: Union[int, float] = 0,
text: str = "",
start_dots_values: list = None,
):
"""Class initialization.
Args:
start_end_points (Tuple[tuple, tuple]): Left top and right top points. ((x1,y1), (x2,y2)).
row_count (int, optional): Table row count. Defaults to 0.
row_height (Union[int, float], optional): Table row height. Defaults to 0.2.
visible_row_count (int, optional): Table visible row count. Defaults to 0.
colors (list, optional): List with dot colors. Defaults to None.
bins (Union[int, float], optional): Count of possible dots values.
Defaults to 0.
text (str, optional): Text for adding to the table. Ex "Customer"
Defaults to "".
start_dots_values (list, optional): List with initial values for the dots.
Defaults to None.
"""
self.horizontal_line = [
ShapePoint(start_end_points[0]),
ShapePoint(start_end_points[1]),
]
self.colors = colors or list()
self.bins = bins
column_count = 2
columns_width = (0.8, 0.2)
self.text = text
self.text_scale = 0.6
self.start_dots_values = start_dots_values
self.default_color = "red"
self.customers, self.dots = self._add_dots_and_customers_to_table(
row_count=row_count,
row_height=row_height,
columns_width=columns_width,
)
super().__init__(
start_end_points,
row_count,
row_height,
column_count,
visible_row_count,
columns_width,
BLACK,
1,
*self.customers,
*self.dots,
)
def _add_dots_and_customers_to_table(
self,
row_height: Union[int, float],
row_count: int,
columns_width: Tuple,
) -> Tuple[VGroup, VGroup]:
"""Method for creating dots and texts.
Args:
row_height (Union[int, float]): Table rows height.
row_count (int): Table rows count.
columns_width (Tuple): Table rows width.
Returns:
Tuple[VGroup, VGroup]: Tuple with all dots and texts.
"""
customers = []
dots = []
y_point = self.horizontal_line[0][1]
y_step = row_height
x_left_point = self.horizontal_line[0][0]
x_right_point = self.horizontal_line[1][0]
distance = abs(x_right_point - x_left_point)
step_x = distance * columns_width[0]
# Adding texts and dots
for i in range(row_count):
# Adding text to the table
customer = HistogramText(
f"{self.text} {i+1}",
color=BLACK,
)
# Changing text size
customer.scale(self.text_scale)
# Moving text to the table cell
customer.move_to(
array([x_left_point + 0.2, y_point - (y_step / 2), 0]),
aligned_edge=LEFT_SIDE, # Aligning it at the left side of the cell
)
customers.append(customer)
# Forcing to generate always the same numbers
random.seed(i + 1)
# Adding dot value
if self.start_dots_values and i < len(self.start_dots_values):
dot_value = self.start_dots_values
else:
if isinstance(self.bins, int):
dot_value = random.randrange(1, self.bins + 1)
else:
dot_value = round(random.uniform(1.0, self.bins + 1.0), 1)
if len(self.colors) < dot_value:
dot_color = self.default_color
else:
dot_color = self.colors[int(dot_value) - 1]
# Adding dot
dot = HistogramDot(
value=dot_value,
point=array([x_left_point + step_x + 0.3, y_point - (y_step / 2), 0]),
color=dot_color,
)
dots.append(dot)
y_point -= y_step
customers = VGroup(*customers)
dots = VGroup(*dots)
return customers, dots
Вы спросите — зачем же столько кода, ужасное ООП, куча наследования и так далее? Всё просто: чтобы спрятать ненужную шелуху в классы. Тогда код будет выглядеть максимально читабельным и красивым. Давайте посмотрим, что можно сделать с уже написанным.
Создадим новый метод play_second_scene в классе Scenario. Добавим таблицу: укажем координаты, общее количество строк, количество строк, которое будет видно на экране, и количество корзин в таблице. Добавим метод scene.play, в котором вызовем метод появления таблицы. В файле main.py в методе construct заменим hist.play_first_scene() на hist.play_second_scene().
После этого запускаем рендер видео из консоли с помощью команды
> poetry run python main.py
… и наслаждаемся видом нашей таблицы покупателей:
scenario.py
def play_second_scene(self):
table = CustomersTable(
((-2, 2), (2, 2)),
row_count=10,
visible_row_count=10,
bins=2,
)
self.scene.play(FadeIn(table))
self.scene.wait(3)
Теперь у нас осталась всего одна инициализация таблицы и один вызов метода появления. Код чистый, красивый, с ним легко следить за сценарием видео, его легко поддерживать. Вся кастомизация вынесена в классы, и мы о ней вообще не задумываемся.

Пойдём дальше — таким же способом создадим классы для графика и воронки.
Следующая задача — построение графика. Опишу его параметры:
Небольшое пояснение к коду: во-первых, мы снова используем наследование. То есть создаём класс Graph и делаем его абстрактным. В этот класс добавляем общий для всех потомков метод _prepare_next_dot_coords и абстрактный метод _create_graph. От класса Graph наследуются два других класса: CategoricalGraph и ContinuousGraph. Во-вторых, благодаря питоническому Multiple Inheritance в классы-наследники добавляется VGroup, и на выходе получается новый объект, которым можно манипулировать (добавлять в сцену, удалять, перемещать и т. д.).
classes/graph.py
Теперь соберём всё в метод play_third_scene и запустим сборку, как в предыдущем варианте:
scenario.py
def play_third_scene(self):
cont_graph = ContinuousGraph(
((-4, -1), (0, -1)),
((-2, 1), (-2, -3)),
bins=4,
annot=False,
)
cat_graph = CategoricalGraph(
((0, 2), (4, 2)),
None,
bins=4,
annot=True,
)
self.scene.play(FadeIn(cont_graph), FadeIn(cat_graph))
self.scene.wait(3)
В итоге мы получили два графика: непрерывный и дискретный. У каждого своя логика отрисовки корзин и подписи:

Осталось нарисовать только воронки. Как и объекты, которые мы создавали ранее, воронки представляют собой набор линий с определёнными координатами. Однако перед тем, как перейти к их созданию, вспомним изначальное видео и второй сценарий. Шарики должны падать именно в свою воронку, а не в какую-то другую, плюс не просто переноситься, а именно скатываться по горлышку воронки.
Также нам нужно, чтобы воронка была самостоятельным объектом. Это даст возможность строить столько воронок, сколько нужно. Мы напишем два класса: один для воронки, а второй для управления построением воронок. Звучит сложно, но здесь и начинается всё самое интересное!
classes/funnel.py
from typing import Tuple, Union
from colour import Color
from manimlib.imports import BLACK, Line, VGroup
from numpy import array, mean
from .histogram_text import HistogramText
from .shape_point import ShapePoint
class Funnel(VGroup):
text_scale: Union[int, float] = 0.6
def __init__(
self,
start_end_points: Tuple[tuple, tuple],
height: Union[int, float],
point_radius: Union[int, float],
annot: bool = False,
annot_text: str = "",
lines_color: Color = BLACK,
stroke_width: Union[int, float] = 1,
):
"""Funnel initialization.
Args:
start_end_points (Tuple[tuple, tuple]): Left top and right top points. ((x1,y1), (x2,y2)).
height (Union[int, float]): Funnel height.
point_radius (Union[int, float]): Point radius. With that value we could calculate the opening
of the funnel.
annot (bool, optional): Do we need to annotate the funnel or not. Defaults to False.
annot_text (str, optional): Text to annotate funnel. Defaults to "".
lines_color (Color, optional): Lines color for the funnel. Defaults to BLACK.
stroke_width (Union[int, float], optional): Line width for the funnel. Defaults to 1.
"""
self.left_top_point = ShapePoint(start_end_points[0])
self.right_top_point = ShapePoint(start_end_points[1])
self.height = height
self.point_radius = point_radius
self.point_diameter = point_radius * 1.5
self.lines_color = lines_color
self.stroke_width = stroke_width
self.annot = annot
self.annot_text = annot_text
self.y_point_top = self.left_top_point[1]
self.y_point_bottom = self.y_point_top - self.height
self.x_point_left = self.left_top_point[0]
self.x_point_right = self.right_top_point[0]
self.y_bottom_shift = 0.2
self.x_funnel_center = mean(array([self.right_top_point[0], self.left_top_point[0]]))
self.left_to_bottom = Line(
array([self.x_point_left, self.y_point_top, 0]),
array([self.x_point_left, self.y_point_bottom, 0]),
color=self.lines_color,
stroke_width=self.stroke_width,
)
self.left_to_bottom_right = Line(
array([self.x_point_left, self.y_point_top, 0]),
array([self.x_funnel_center - self.point_diameter, self.y_point_top - 0.5, 0]),
color=self.lines_color,
stroke_width=self.stroke_width,
)
self.right_to_bottom = Line(
array([self.x_point_right, self.y_point_top, 0]),
array([self.x_point_right, self.y_point_bottom, 0]),
color=self.lines_color,
stroke_width=self.stroke_width,
)
self.right_to_bottom_left = Line(
array([self.x_point_right, self.y_point_top, 0]),
array([self.x_funnel_center + self.point_diameter, self.y_point_top - 0.5, 0]),
color=self.lines_color,
stroke_width=self.stroke_width,
)
self.left_funnel_appendix = Line(
array([self.x_funnel_center + self.point_diameter, self.y_point_top - 0.5, 0]),
array([self.x_funnel_center + self.point_diameter, self.y_point_top - 0.7, 0]),
color=self.lines_color,
stroke_width=self.stroke_width,
)
self.right_funnel_appendix = Line(
array([self.x_funnel_center - self.point_diameter, self.y_point_top - 0.5, 0]),
array([self.x_funnel_center - self.point_diameter, self.y_point_top - 0.7, 0]),
color=self.lines_color,
stroke_width=self.stroke_width,
)
self.bottom_line = Line(
array([self.x_point_left - 0.2, self.y_point_bottom + self.y_bottom_shift, 0]),
array([self.x_point_right + 0.2, self.y_point_bottom + self.y_bottom_shift, 0]),
color=self.lines_color,
stroke_width=self.stroke_width,
)
texts = []
if annot:
text = HistogramText(annot_text, color=self.lines_color)
text.move_to(array([self.x_funnel_center, self.y_point_bottom, 0]))
text.scale(self.text_scale)
texts.append(text)
super().__init__(
self.left_to_bottom,
self.right_to_bottom,
self.left_to_bottom_right,
self.right_to_bottom_left,
self.left_funnel_appendix,
self.right_funnel_appendix,
self.bottom_line,
*texts,
)
Создадим четвёртую сцену, определив необходимые параметры для создания воронок, и запустим сборку:
scenario.py
def play_fourth_scene(self):
funnel = Funnel(
((-2, 2), (1, -2)),
height=4,
point_radius=0.2,
)
self.scene.play(
FadeIn(funnel),
)
self.scene.wait(3)
Теперь у нас появились красивые воронки, с которыми можно работать дальше:

Итак, у нас есть воронки, графики, таблицы, шарики… Но мы пока что не сделали одну важную вещь — сейчас эти объекты статические. То есть мы их определили, отобразили и на этом всё. Нам же нужно, чтобы шарики могли взаимодействовать с остальными объектами, перемещаясь по ним.
По сценарию у нас есть таблица со списком покупателей, где напротив каждого покупателя нарисован шарик с количеством покупок (значение шарика). Для отображения количества покупок в виде гистограммы нужно создать график, вывести его на экран и затем перенести на него шарики так, чтобы каждому значению шарика соответствовало такое же значение на графике.
Для реализации этой логики создадим (ни за что не догадаетесь) класс! Назовем его Movable. Класс будет иметь собственный словарь _next_dot_coords, в котором лежат координаты всех точек, уже перенесённых на график, а также метод _get_next_dot_coords, который по значению шарика будет отдавать его координаты на графике и, наконец, метод drag_in_dots, отвечающий за «притяжение» к себе всех шариков.
Пояснение: есть таблица с шариками и график. Вызываем метод графика drag_in_dots, в который передаём шарики, находящиеся в данный момент в таблице. В цикле проходимся по шарикам, где для каждого шарика вызываем метод графика _get_next_dot_coords, который отдаёт новые координаты шарика, и перемещаем шарики на новые координаты. Готово.
И всё-таки совсем понятно станет после реализации. Давайте ей и займёмся:
classes/movable_graph.py
from abc import ABC
from copy import deepcopy
from typing import Dict, Union
from manimlib.imports import DEFAULT_ANIMATION_RUN_TIME, ApplyMethod, Scene, Transform, VGroup
from numpy import array, ndarray
from .graph import CategoricalGraph, ContinuousGraph
from .histogram_dot import HistogramDot
class Movable(ABC):
"""Abstract class to add 'movable' functionality to the graph"""
_next_dot_coords: Dict[Union[int, float], Dict[str, Union[int, float]]] = {}
dot_padding: Union[int, float] = 0
def __init__(self, *args, **kwargs):
self._next_dots_coords = self._prepare_next_dot_coords()
super().__init__(*args, **kwargs)
def _get_next_dot_coords(self, dot: HistogramDot) -> ndarray:
"""Getting points for dots to move.
Args:
dot (HistogramDot): Dot from which we will calculate current coordinates.
Returns:
array: Next dot location.
"""
current_coord = self._next_dots_coords.get(int(dot.value), {})
bin_center = array([current_coord.get("x", 0), current_coord.get("y", 0), 0])
self._next_dots_coords[int(dot.value)]["y"] = current_coord.get("y", 0) + dot.radius + self.dot_padding
return bin_center
def drag_in_dots(
self,
scene: Scene,
dots: VGroup,
animate_slow: int,
animate_rest: bool,
run_time: Union[int, float] = None,
delay: Union[int, float] = None,
):
"""Moving dots to the graph.
Args:
scene (Scene): Scene where all our objects are located.
dots (VGroup): List of dots to move.
animate_slow (int): How many dots do we need to animate slowly.
animate_rest (bool): Do we need to move the rest of the dots or not.
run_time (Union[int, float]): How quickly we need to animate dots. Defaults to None.
delay (Union[int, float], optional): Delay between animations. Defaults to None.
"""
if not run_time:
run_time = DEFAULT_ANIMATION_RUN_TIME
for dot in dots[:animate_slow]:
scene.play(
ApplyMethod(dot.move_to, self._get_next_dot_coords(dot)),
run_time=run_time,
)
if delay:
scene.wait(delay)
if animate_rest:
dots_rest = deepcopy(dots[animate_slow:])
for dot in dots_rest:
dot.move_to(self._get_next_dot_coords(dot))
scene.play(Transform(dots[animate_slow:], dots_rest))
scene.remove(dots[animate_slow:])
else:
for dot in dots[animate_slow:]:
dot.move_to(self._get_next_dot_coords(dot))
class MovableContinuousGraph(ContinuousGraph, Movable):
"""Continuous graph that could move dots"""
class MovableCategoricalGraph(CategoricalGraph, Movable):
"""Categorical graph that could move dots"""
Теперь создадим видео по первому сценарию: выведем на экран таблицу с шариками, затем график и переместим на него шарики из таблицы.
scenario.py
def play_fifth_scene(self):
# Initial dot values, to keep them the same over several animation builds
start_dot_values = [1, 2, 1, 3, 4, 2, 1]
# Table initialization
table = CustomersTable(
((-6, 2), (-2, 2)),
row_count=10,
visible_row_count=10,
bins=4,
start_dots_values=start_dot_values,
)
# Graph initialization
x_graph = MovableCategoricalGraph(
((0, 0), (4, 0)),
None,
bins=4,
annot=True,
)
# Playing animation for the table and graph appearing
self.scene.play(FadeIn(table), FadeIn(x_graph))
self.scene.wait(2)
# Moving dots from the table to the graph
x_graph.drag_in_dots(self.scene, dots=table.dots, animate_slow=3, animate_rest=True)
self.scene.wait(3)
После сборки получим такую прекрасную анимацию:

Всё здорово, остался последний элемент — воронки тоже нужно сделать динамическими. Movable-воронкам для перемещения шариков не подойдёт простой drag_in, потому что метод должен определять, к какой воронке относится шарик, а после отрисовывать, как шарик скатывается по ней внутрь. Звучит интересно, давайте попробуем реализовать.
Во время создания воронок класс Funnel запоминает все линии с координатами. То есть мы легко можем сравнить их с координатами шарика, который должен упасть в воронку.
Весь алгоритм состоит из следующих пунктов:
После нахождения координат рассчитываем три точки, куда должен упасть шарик:
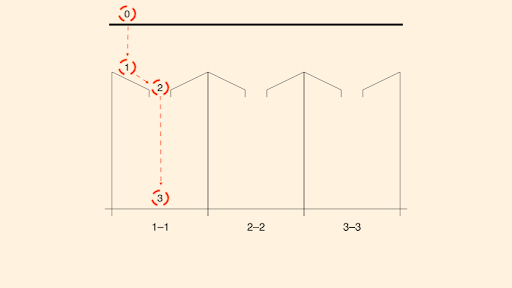
Ну а дальше самое интересное. Для перемещения шарика из точки 0 в точку 1 нужно знать X и Y точки 1. X мы знаем — он такой же, как и у шарика. А вот точку Y придётся высчитывать. У нас есть координаты начала и конца линии, на которую будет падать шарик, соответственно, мы можем рассчитать X для точки падения. Однако вручную делать это не нужно.Хороший программист — ленивый программист. Хороший программист читает документацию. А в документации к библиотеке numpy описан метод interp, который делает ровно то, что нам нужно: интерполирует X, исходя из доступного набора значений. Ну а вторая и третья точка находятся максимально просто:
point_x = dot.get_x()
first_point = None
second_point = None
# Looking for the Line for Dot to move (fall)
if self.x_point_left <= point_x <= x_left_to_bottom_right:
line = self.left_to_bottom_right
elif x_right_to_bottom_left <= point_x <= self.x_point_right:
line = self.right_to_bottom_left
elif x_left_to_bottom_right < point_x < x_right_to_bottom_left:
line = None
else:
return None, None, None
if line is not None:
# Getting all X, Y points from the line
line_x = [x[0] for x in line.get_all_points()]
line_y = [x[1] for x in line.get_all_points()]
# Where the magic happens. We're interpolating Y from other X, Y points.
point_y = interp(point_x, line_x, line_y, period=10)
point_y += 0.25
first_point = array([point_x, point_y, 0])
second_point = array([self.x_funnel_center, funnel_center_y, 0])
third_point = array([self.x_funnel_center, current_coord, 0])
Полный код класса MovableFunnel:
classes/movalbe_funnel.py
from copy import deepcopy
from typing import Dict, Tuple, Union
from manimlib.imports import ApplyMethod, Scene, Transform, VGroup
from numpy import array, interp
from .funnel import Funnel
from .histogram_dot import HistogramDot
class MovableFunnelException(Exception):
pass
class LineNotFoundException(MovableFunnelException):
pass
class MovableFunnel(Funnel):
"""Overridden Funnel class to add 'movable' functionality"""
_next_dot_coords: Dict[str, Union[int, float]] = {}
dot_padding: Union[int, float] = 0.22
animated_slowly: int = None
def __init__(
self,
start_end_points: Tuple[tuple, tuple],
run_time: Union[int, float],
*args,
**kwargs,
):
"""Class initialization. It receives all parameters that the Funnel class needs.
Args:
start_end_points (Tuple[tuple, tuple]): Left top and right top points. ((x1,y1), (x2,y2)).
run_time (Union[int, float]): How quickly we need to animate dots.
"""
self.run_time = run_time
super().__init__(start_end_points, *args, **kwargs)
self._next_dots_coords = {
"x": self.x_funnel_center,
"y": self.y_point_bottom + (self.y_bottom_shift * 2),
}
def _get_next_dots_coords(
self, dot: HistogramDot
) -> Union[Tuple[array, array, array], Tuple[None, None, array], Tuple[None, None, None]]:
"""Getting points for dots to move.
Args:
dot (HistogramDot): Dot from which we will calculate current coordinates.
Returns:
Union[
Tuple[array, array, array],
Tuple[None, None, array],
Tuple[None, None, None,]
]: Tuple with the points for the next dot move (fall).
"""
# Getting all needed coordinates of the funnel
current_coord = self._next_dots_coords.get("y")
x_left_to_bottom_right = self.left_to_bottom_right.get_all_points()[-1][0]
x_right_to_bottom_left = self.right_to_bottom_left.get_all_points()[-1][0]
funnel_center_y = self.left_to_bottom_right.get_all_points()[-1][1] + 0.1
point_x = dot.get_x()
first_point = None
second_point = None
# Looking for the Line for Dot to move (fall)
if self.x_point_left <= point_x <= x_left_to_bottom_right:
line = self.left_to_bottom_right
elif x_right_to_bottom_left <= point_x <= self.x_point_right:
line = self.right_to_bottom_left
elif x_left_to_bottom_right < point_x < x_right_to_bottom_left:
line = None
else:
return None, None, None
if line is not None:
# Getting all X, Y points from the line
line_x = [x[0] for x in line.get_all_points()]
line_y = [x[1] for x in line.get_all_points()]
# Where the magic happens. We're interpolating Y from other X, Y points.
point_y = interp(point_x, line_x, line_y, period=10)
point_y += 0.25
first_point = array([point_x, point_y, 0])
second_point = array([self.x_funnel_center, funnel_center_y, 0])
third_point = array([self.x_funnel_center, current_coord, 0])
# Remembering current position
self._next_dots_coords["y"] = current_coord + dot.radius + self.dot_padding
return first_point, second_point, third_point
def drag_in_dots(self, scene: Scene, dots: VGroup, animate_slow: int, animate_rest: bool):
"""Moving dots from anywhere to the funnel.
Args:
scene (Scene): Scene where all our objects are located.
dots (VGroup): List of dots to move.
animate_slow (int): How many dots do we need to animate slowly.
animate_rest (bool): Do we need to move the rest of the dots or not.
"""
if animate_slow > len(dots):
animate_slow = len(dots)
animated_slowly = 0
for dot in dots[:animate_slow]:
first_point, second_point, third_point = self._get_next_dots_coords(dot)
if all(x is None for x in (first_point, second_point, third_point)):
continue
if first_point is not None:
scene.play(ApplyMethod(dot.move_to, first_point), run_time=self.run_time)
scene.play(ApplyMethod(dot.move_to, second_point), run_time=self.run_time)
scene.play(ApplyMethod(dot.move_to, third_point), run_time=self.run_time)
animated_slowly += 1
dots_rest = deepcopy(dots[animate_slow:])
for dot in dots_rest:
*_, third_point = self._get_next_dots_coords(dot)
if third_point is None:
continue
dot.move_to(third_point)
if dots_rest:
if animate_rest:
scene.play(Transform(dots[animate_slow:], dots_rest))
else:
scene.add(dots_rest)
scene.remove(dots_rest)
self.animated_slowly = animated_slowly
Последний класс на сегодня — Funnels — нужен для создания нескольких воронок сразу, а также чтобы вызвать метод drag_in_dots для каждой из них.
Получаем крайние точки воронок в методе init, делим расстояние на количество воронок, а затем в цикле добавляем готовые объекты Funnel. Для метода drag_in_dots добавляем расчет параметра animmate_slow, чтобы анимировать падение в начале анимации, а не отдельно для каждой воронки.
classes/funnels.py
from typing import List, Tuple, Union
from manimlib.imports import Scene, VGroup
from classes.movable_funnel import MovableFunnel
from .funnel import Funnel
from .shape_point import ShapePoint
class FunnelsExeption(Exception):
"""General exception for Funnels class"""
class Funnels(VGroup):
funnels: List[Funnel] = []
def __init__(
self,
start_end_points: Tuple[tuple, tuple],
funnel: Funnel,
count: int,
bins: Union[int, float],
annot: bool = False,
*args,
**kwargs,
):
"""Object-constructor for the funnels. Inside init, you could pass all needed variables that will be
passed to the Funnel init as well.
Args:
start_end_points (Tuple[tuple, tuple]): Left top and right top points. ((x1,y1), (x2,y2)).
funnel (Funnel): Class for funnel building. Must be inherited from Funnel.
count (int): Funnels count.
bins (Union[int, float]): Bins count for funnels.
annot (bool, optional): Annotate funnels or not. Defaults to False.
Example:
funnels = Funnels(
start_end_points=((-6.5, -4), (6.5, -4)),
funnel=MovableFunnel,
count=5,
bins=bins,
annot=True,
point_radius=0.2,
run_time=0.8,
height=4,
)
"""
self.left_top_point = ShapePoint(start_end_points[0])
self.right_top_point = ShapePoint(start_end_points[1])
self.bins = bins
self.count = count
step = abs((self.right_top_point[0] - self.left_top_point[0]) / count)
x_start_point = self.left_top_point[0]
x_end_point = x_start_point + step
y_point = self.left_top_point[1]
# Creating list for the annotation texts
annot_step = int(self.bins / self.count)
annot_bins = [i for i in range(0, int(self.bins) + annot_step, annot_step)]
annots = [f"{x+1}–{y}" for x, y in zip(annot_bins[:-1], annot_bins[1:])]
# Creating funnels in cycle
for i in range(self.count):
self.funnels.append(
funnel(
*args,
start_end_points=(
(x_start_point, y_point),
(x_end_point, y_point),
),
annot=annot,
annot_text=annots,
**kwargs,
)
)
x_start_point, x_end_point = x_end_point, x_end_point + step
super().__init__(*self.funnels)
def drag_in_dots(self, scene: Scene, dots: VGroup, animate_slow: int, animate_rest: bool):
"""Method for moving dots into funnels. Calls the same method drag_in_dots for every funnel
in self.funnels.
Args:
scene (Scene): Scene class.
dots (VGroup): Dots that we need to move.
animate_slow (int): How many dots we need to animate slowly.
animate_rest (bool): Do we need to move the rest of the dots or not.
Raises:
FunnelsExeption: Raises when funnels were not created with MovableFunnel class.
"""
if any(not isinstance(x, MovableFunnel) for x in self.funnels):
raise FunnelsExeption('method "drag_in_dots" allowed only for "MovableFunnel"')
# We are sorting dots ascending to be able to play animation from the smallest dot to the biggest.
_dots = VGroup(*sorted(dots, key=lambda x: x.value))
for funnel in self.funnels:
funnel.drag_in_dots(
scene=scene,
dots=_dots,
animate_slow=animate_slow,
animate_rest=animate_rest,
)
animate_slow = animate_slow - funnel.animated_slowly
Запустим сборку проекта, добавив новый сценарий, и посмотрим, как всё работает:
scenario.py
def play_sixth_scene(self):
bins = 100
funnels = Funnels(
start_end_points=((-6.5, 0), (6.5, 0)),
funnel=MovableFunnel,
count=5,
bins=bins,
annot=True,
point_radius=0.2,
run_time=0.8,
height=3,
)
start_dot_values = [1, 2, 1, 3, 4, 2, 1]
table = CustomersTable(
((-5, 2), (-1, 2)),
row_count=3,
visible_row_count=3,
bins=4,
start_dots_values=start_dot_values,
)
self.scene.add(funnels, table)
funnels.drag_in_dots(
scene=self.scene,
dots=table.dots,
animate_slow=3,
animate_rest=False,
)
Давайте наконец соединим всё то, что мы уже сделали, чтобы получить результат — видео по сценарию номер два. Алгоритм будет таким:
classes/scenario.py
def play_whole_scenario(self):
# Dot bins maximum value
bins = 100
# Adding dot colors (from green to red)
dot_colors = list(Color("#7fcc81").range_to("#ff7555", int(bins)))
# Initial dot values, to keep them the same over several animation builds
start_dots_values = [31, 25, 63, 47, 82, 25, 49, 99, 21, 33, 37]
# Custom text for the table (Customer/buyer)
table_text = "Заказчик"
# Table initialization
table = CustomersTable(
((-6.5, 3), (-2.5, 3)),
row_count=30,
visible_row_count=11,
bins=bins,
colors=dot_colors,
start_dots_values=start_dots_values,
text=table_text,
)
# Graph initialization
x_graph = MovableContinuousGraph(
((-2, -3), (6.5, -3)),
None,
bins=bins,
annot=True,
)
# New graph that will be on the whole screen width
x_graph_second_position = MovableContinuousGraph(
((-6.5, -3), (6.5, -3)),
None,
bins=bins,
annot=True,
)
# Copying dots. This is for future needs.
dots_second_position = deepcopy(table.dots)
# Playing animations
self.scene.play(FadeIn(table), FadeIn(x_graph))
self.scene.wait(2)
# Moving dots from the table to the graph
x_graph.drag_in_dots(
self.scene,
dots=table.dots,
animate_slow=3,
animate_rest=True,
)
self.scene.wait(3)
# Removing graph
self.scene.play(FadeOut(table.lines), FadeOut(table.customers))
# Moving dots from the first graph to the second
x_graph_second_position.drag_in_dots(
scene=self.scene,
dots=dots_second_position,
animate_slow=0,
animate_rest=False,
)
# Playing animation with moving graphs from position 1 to position 2, and same for the dots.
self.scene.play(
Transform(x_graph, x_graph_second_position),
Transform(table.dots, dots_second_position),
)
self.scene.wait(3)
# Adding funnels
funnels = Funnels(
start_end_points=((-6.5, -4), (6.5, -4)),
funnel=MovableFunnel,
count=5,
bins=bins,
annot=True,
point_radius=0.2,
run_time=0.8,
height=4,
)
# Adding funnels to the screen
self.scene.add(funnels)
# Moving camera to the bottom
self.scene.play(self.scene.camera_frame.move_to, array([0, -5.5, 0]))
self.scene.wait(1)
# Moving dots from the graph to the funnels
funnels.drag_in_dots(
scene=self.scene,
dots=table.dots,
animate_slow=9,
animate_rest=True,
)
self.scene.wait(3)
# Removing all objects from scene
self.scene.play(
FadeOut(funnels),
FadeOut(table.dots),
FadeOut(x_graph),
FadeOut(x_graph_second_position),
)
# Moving scene back to center
self.scene.play(self.scene.camera_frame.move_to, array([0, 0, 0]))
self.scene.wait(1)
В main.py меняем вызов предыдущего сценария на play_whole_scenario, запускаем рендер и получаем видео:
Вуаля!

 habr.com
А теперь поехали!
Готовим проект к запуску
Для начала установим пакеты LaTeX и FFmpeg в систему — они нужны для рендера видео и текста (все операции производятся в macOS Big Sur). Для установки LaTeX перейдём на сайт www.tug.org/mactex, скачаем и установим пакет в систему. Есть и более каноничный вариант — использовать Brew и сразу установить оба пакета, как и написано в Readme репозитория:
> brew install ffmpeg mactex
Важно! Иногда после установки Manim отказывается рендерить видео, в которых есть русский текст (возможно, это особенности MacOS). Сначала я грешил на неправильную установку LaTeX, так как ошибка указывала именно на него, но дело оказалось в другом. Объясню ниже.
Собирать и запускать проект будем по-модному — через Poetry.
> poetry new habr_manim
> cd habr_manim
> poetry add manimlib
> touch main.py
> mkdir classes
Пробуем создать простейшее видео
Для создания видео нам потребуются:
- текст,
- шарики (точки),
- эффекты появления и затухания.
В нашем примере новым объектом будет только текст, так как для применения собственного шрифта стандартный класс необходимо перегрузить, добавив переменную класса CONFIG. Остальные элементы — стандартные классы из Manim.
Создадим файл histogram_text.py со следующим содержимым:
classes/histogram_text.py
Для создания шариков используем элемент библиотеки Dot, который принимает кучу разных параметров. Нам нужны следующие:
- point (координаты объекта на плоскости),
- radius (размер),
- stroke_width (ширина обводки),
- stroke_color (цвет обводки),
- color (цвет кружка).
Полный вариант кода будет ниже, а пока опишу основные методы и классы, которые нам пригодятся:
- Scene — класс сцены,
- Scene.add() — метод добавления объектов на сцену,
- Scene.play() — метод проигрывания анимации,
- Scene.wait() — метод ожидания,
- Dot() — класс точки,
- VGroup() — класс для группировки объектов сцены,
- HistogramText — класс текста,
- HistogramText.move_to() — метод перемещения текста на сцене,
- HistogramText.scale() — метод изменения размера текста,
- FadeIn — класс анимации появления объекта в сцене,
- FadeOut — класс анимации исчезновения объекта из сцены.
Создадим в корне проекта файл scenario.py, в котором опишем основные сценарии для разных анимаций. Код в этом файле будет похож на действительный сценарий (обратите внимание на метод play_whole_scenario() — яркий пример такой реализации), а всю остальную логику спрячем в классы-объекты сцены. Начнём с самого простого — приветственной видеозаставки «Гистограммы».
scenario.py
from manimlib.imports import MovingCameraScene, Dot, VGroup, BLACK, FadeIn, FadeOut
from numpy import array
from random import randint
from classes import HistogramText
class Scenario:
def __init__(self, scene: Scene):
"""Main scenario class initialization.
Args:
scene (Scene): Instance of the Scene class.
"""
self.scene = scene
def play_first_scene(self):
# We are creating list for storing dots
dots = []
# Columns with dots will be placed one after another, so X position
# will be calculated automatically
start_x = -4
# Dot size
point_radius = 0.3
for _ in range(5):
# Dots inside columns will be placed one above the other, so Y position
# will be calculated automatically
start_y = -2
for _ in range(randint(2, 6)):
dots.append(
Dot(
point=array([start_x, start_y, 0]), # Coordinates on the screen, assigned with x,y,z
radius=point_radius, # Dot size
stroke_width=1, # Border width
stroke_color=BLACK, # Border color
color="#7fcc81", # Dot color
)
)
start_y += 0.7
start_x += 2
# Grouping dots into VGroup that is the Scene's element
dots = VGroup(*dots)
# Adding dots to the scene
self.scene.add(dots)
# Creating text. We are using our own Overridden class.
heading = HistogramText("Гистограммы", color=BLACK)
# Changin text size with scale
heading.scale(2)
# Changing text location
heading.move_to(array([0, 2.5, 0]))
# Playing animation for the text appearing
self.scene.play(FadeIn(heading))
# Waiting
self.scene.wait(2)
# Playing animation for the text disappearing
self.scene.play(FadeOut(dots), FadeOut(heading))
# Waiting
self.scene.wait(1)
Все файлы готовы. Чтобы запуститься, нам осталось лишь донастроить приложение, вызвав из main.py сценарий.
Класс MainScene отвечает за запуск приложения. Для запуска рендера видео этот класс обязательно должен наследоваться от CameraScene (мы будем наследоваться от MovingCameraScene, так как для дальнейшей разработки понадобятся методы перемещения камеры, которых нет в стандартной CameraScene). В нашем классе объявлена переменная CONFIG, в которую можно добавить настройки сцены. Метод construct — точка входа в приложение. Вот как это выглядит в коде:
main.py
import os
from pathlib import Path
# We are importing MovingCamera, instead of CameraScene to be able to
# move the camera around.
from manimlib.imports import MovingCameraScene
from config import SCENE_BACKGROUND_COLOR
from scenario import Scenario
# Adding flags to build animation.
# -l (low quality)
# -s (only screenshot)
RESOLUTION = ""
FLAGS = f"-pl {RESOLUTION}"
SCENE = "MainScene"
class MainScene(MovingCameraScene):
# Scene background is black by default, to change it we need to
# override CONFIG dictionary.
CONFIG = {
"camera_config": {
"background_color": SCENE_BACKGROUND_COLOR,
},
}
def construct(self):
"""Construct method - enter point to create animation"""
hist = Scenario(self)
hist.play_first_scene()
if __name__ == "__main__":
script_name = Path(__file__).resolve()
os.system(f"manim {script_name} {SCENE} {FLAGS}")
Итоговая структура проекта получилась такой:
classes/
__init__.py
histogram_text.py
main.py
scenario.py
pyproject.toml
Приложение готово к первому запуску. Изменим pyproject.toml, добавив директорию packages с нашими классами и соберём проект:
> vi pyproject.toml
[tool.poetry]
...
packages = [
{ include = "classes" }
]
> poetry build
> poetry install
> poetry run python main.py
Первая анимация готова!
Решаем проблему рендеринга русскоязычного текста
Что делать, если вы столкнулись с проблемой рендеринга русского текста? Рассказываю:
> poetry env info
Копируем путь к venv, он будет выглядеть примерно так: ~/Library/Caches/pypoetry/virtualenvs/habr-manim-jyKtqU_G-py3.7
Находим файл tex_template.tex в виртуальном окружении и редактируем его:
> vi ~/Library/Caches/pypoetry/virtualenvs/habr-manim-jyKtqU_G-py3.7/lib/python3.7/site-packages/manimlib/tex_template.tex
Сверяемся, чтобы содержимое было следующего вида:
\documentclass[preview]{standalone}
\usepackage[english]{babel}
\usepackage[utf8]{inputenc}
\usepackage[T1]{fontenc}
\usepackage{amsmath}
\usepackage{amssymb}
\usepackage{dsfont}
\usepackage{setspace}
\usepackage{tipa}
\usepackage{relsize}
\usepackage{textcomp}
\usepackage{mathrsfs}
\usepackage{calligra}
\usepackage{wasysym}
\usepackage{ragged2e}
\usepackage{physics}
\usepackage{xcolor}
\usepackage{microtype}
\DisableLigatures{encoding = *, family = * }
%\usepackage[UTF8]{ctex}
\linespread{1}
\begin{document}
YourTextHere
\end{document}
Сохраняем файл. Теперь русский текст будет отображаться нормально.
Итого мы сделали каркас для приложения, настроили его к запуску, переопределили стандартный класс текста, чтобы применить собственный шрифт, и создали видео для вступления. Но дальше — больше. Будем строить график, таблицу, воронку и шарики.
Определяем сценарии анимации
Дисклеймер! Противникам ООП после прочтения может стать плохо. Сначала определим сценарий и объекты, необходимые для его реализации:
Сценарий 1
- появление таблицы и шариков,
- появление графика,
- перенос шариков из таблицы на график.
Сценарий 2
- появление таблицы и шариков,
- появление графика,
- перенос шариков из таблицы на график,
- появление корзин (воронок),
- перенос шариков с графика в воронку.
Исходя из этих сценариев, нам понадобятся следующие объекты:
- таблица (должна быть динамической длины),
- график (нужно два вида, дискретный и непрерывный),
- шарики (должны хранить значение),
- воронки (воронам нужно прописать физику падения для шариков).
Создаём шарики
Начнём с самого простого. В директорию classes добавим новый файл — histogram_dot.py, в котором определим класс для шарика. Код ниже под спойлером, но ключевые моменты объясню тут:
- Все классы новых объектов должны наследовать уже существующие классы Manim. В случае шарика мы наследуем класс VGroup, который формирует группу из текста и точки. Так мы можем создавать любые объекты, группируя их в VGroup и работая с ними как с одним объектом-группой.
- После инициализации существующих объектов не забываем проинициализировать родителя (super) с передачей созданных объектов.
classes/histogram_dot.py
from typing import Dict, Union
from colour import Color
from manimlib.imports import BLACK, WHITE, Dot, VGroup
from numpy import ndarray
from .histogram_text import HistogramText
from .shape_point import ShapePoint
class HistogramDot(VGroup):
"""This class contains Dot, Text and all needed info that we want, such as 'value'"""
colors: Dict[int, str] = {
1: "#7FCC81", # green
2: "#FFE236", # yellow
3: "#FFB742", # orange
4: "#FF7555", # red
}
dot_scale_float: Union[int, float] = 0.25
dot_scale_int: Union[int, float] = 0.4
radius: Union[int, float] = 0.2
def __init__(
self,
value: int,
point: ndarray,
radius: float = None,
color: Color = None,
):
"""Class initialization.
Args:
value (int): Text of the dot.
point (array): Location on the screen.
radius (float, optional): Dot radius. Defaults to None.
color (Color, optional): Dot color. Defaults to None.
"""
self.value = value
self.radius = radius or self.radius
if not color:
color = self.colors.get(value, WHITE)
dot = Dot(
point=point,
radius=self.radius,
color=color,
stroke_color=BLACK,
stroke_width=1,
)
text = HistogramText(str(self.value), color=BLACK)
self.point = ShapePoint(point)
# We are changing the text size to be able to add it inside a d
if isinstance(self.value, float):
text.scale(self.dot_scale_float)
else:
text.scale(self.dot_scale_int)
# Moving text inside a dot
text.move_to(dot.get_center())
super().__init__(dot, text)
def __repr__(self):
return f"{self.__class__.__name__}({self.value}, {self.point}, {self.radius}, {self.color})"
Создаём таблицу
Теперь напишем класс для построения таблицы и добавим в него возможность настройки размеров и параметров. В рамках нашей задачи удобство и универсальность важнее, чем single-responsibility principle. Поэтому мы сделаем так, чтобы построение таблицы вызывалось одним методом и работало максимально просто. Сама таблица в этом случае тоже является объектом VGroup и состоит из кучи линий, текста и шариков.
Чтобы не запутаться, разделим таблицу на обычную (класс Table, состоящий из линий) и таблицу покупателей (она наследует Table и дополняет линии текстом и шариками). В процессе построения на вход подаются кортежи с координатами, их валидацию мы выносим в отдельный класс-helper ShapePoint. Он будет валидировать и обозначать координаты точек на плоскости.
classes/shape_point.py
from typing import Tuple, Union
from numpy import array, ndarray
class ShapePointException(Exception):
pass
class ShapePointTypeError(ShapePointException):
pass
class ShapePointTooManyValuesException(ShapePointException):
pass
class ShapePoint:
"""Class for validation and storing information about screen points"""
_coords: ndarray
def __init__(self, coords: Tuple[Union[int, float], Union[int, float]]):
self.coords = coords
@property
def coords(self):
return self._coords
@coords.setter
def coords(self, value: Tuple[Union[int, float], Union[int, float]]):
"""Method -setter for validation and storing coordinates.
Args:
value (Tuple[Union[int, float], Union[int, float]]): tuple with coordinates
Raises:
ShapePointTypeError: Wrong data type was passed.
ShapePointTooManyValuesException: You put too many variables inside tuple.
ShapePointTypeError: Data inside tuple is in the wrong format.
"""
if not isinstance(value, Tuple) and not isinstance(value, ndarray):
detail = f"Coords must be a type of: [tuple, np.ndarray], got [{type(value)}] instead."
raise ShapePointTypeError(detail)
if isinstance(value, ndarray):
value = value[:2]
if len(value) != 2:
detail = "Coords must contain 2 values"
raise ShapePointTooManyValuesException(detail)
for coord in value:
if not isinstance(coord, int) and not isinstance(coord, float):
detail = f"Values in coords must be a type of: [int, float], got [{coord}:{type(coord)}] instead."
raise ShapePointTypeError(detail)
self._coords = array([value[0], value[1], 0])
def __getitem__(self, item):
return self.coords[item]
def __repr__(self):
return f"{self.__class__.__name__}({self.coords})"
Алгоритм построения базовой таблицы (класс Table) простой: задаём координаты первой линии, количество строк, высоту строк, количество колонок, ширину колонок и количество строк, которое будет видно. Отрисовка каждого элемента на экране занимает время и память, соответственно, в таблице, где видно всего 10 строк из 100, нет смысла рисовать ещё 90. Также задаём цвет и ширину границы. Затем для каждой строки добавляем горизонтальную линию и столько вертикальных линий, сколько у нас колонок. В итоге получаем набор VGroup из линий, который и является таблицей.
Построить таблицу для покупателей (CustomerTable) тоже просто: наследуемся от базового класса и добавляем на каждую строчку текст и шарик. Чтобы числа всегда получались одинаковыми, и не было необходимости вручную вводить кучу значений, в класс CustomerTable добавлен параметр start_dot_values, в который можно добавить именно те значения, о которых говорится в описании таблицы. Все остальные значения генерируются с помощью random.seed() (это псевдорандом, то есть Python генерирует одни и те же числа каждый раз, когда запускаешь проект). Таким образом, запустив скрипт 500 раз, мы получим 500 одинаковых «рандомных» значений (люблю питончик).
Файл таблицы выглядит следующим образом:
classes/table.py
import random
from typing import Tuple, Union
from colour import Color
from manimlib.imports import BLACK, LEFT_SIDE, Line, VGroup
from numpy import array
from .histogram_dot import HistogramDot
from .histogram_text import HistogramText
from .shape_point import ShapePoint
class TableException(Exception):
pass
class TableLineEmptyException(TableException):
pass
class Table(VGroup):
"""Table class. Built from Lines"""
def __init__(
self,
start_end_points: Tuple[tuple, tuple],
row_count: int = 0,
row_height: Union[int, float] = 0.2,
column_count: int = 0,
visible_row_count: int = 0,
columns_width: tuple = None,
lines_color: Color = BLACK,
stroke_width: Union[int, float] = 1,
*args,
**kwargs,
):
"""Class initialization.
Args:
start_end_points (Tuple[tuple, tuple]): Left top and right top points. ((x1,y1), (x2,y2)).
row_count (int, optional): Table row count. Defaults to 0.
row_height (Union[int, float], optional): Table row height. Defaults to 0.2.
column_count (int, optional): Table column count. Defaults to 0.
visible_row_count (int, optional): Table visible row count. Defaults to 0.
columns_width (tuple, optional): Table column width. For 3 columns it looks like
(.4, .4, .2). Defaults to None.
lines_color (Color, optional): Table lines color. Defaults to BLACK.
stroke_width (Union[int, float], optional): Table lines width. Defaults to 1.
Raises:
TableLineEmptyException: Raises when no start_end_points were passed.
"""
if not start_end_points:
detail = "Can't create a graph with the empty start line."
raise TableLineEmptyException(detail)
if columns_width:
assert (
len(columns_width) == column_count
), "Columns count and list with their widths must be the same length."
self.horizontal_line = [
ShapePoint(start_end_points[0]),
ShapePoint(start_end_points[1]),
]
self.row_count = row_count
self.row_height = row_height
self.column_count = column_count
self.visible_row_count = visible_row_count
self.columns_width = columns_width
self.lines_color = lines_color
self.stroke_width = stroke_width
self.lines = self._create_table()
super().__init__(*self.lines, *args, **kwargs)
def _create_table(self) -> VGroup:
"""Method for creating tables.
Returns:
VGroup: Object made from the list of lines (Line).
"""
lines = []
y_point = self.horizontal_line[0][1]
y_step = self.row_height
x_left_point = self.horizontal_line[0][0]
x_right_point = self.horizontal_line[1][0]
distance = abs(x_right_point - x_left_point)
# Drawing table
for i in range(self.row_count + 1):
# Adding horizontal line
lines.append(
Line(
array([x_left_point, y_point, 0]),
array([x_right_point, y_point, 0]),
color=self.lines_color,
stroke_width=self.stroke_width,
)
)
if i == self.row_count:
break
# Adding vertical lines
x_point = x_left_point
for j in range(self.column_count + 1):
lines.append(
Line(
array([x_point, y_point, 0]),
array([x_point, y_point - y_step, 0]),
color=self.lines_color,
stroke_width=self.stroke_width,
)
)
if j == self.column_count:
break
if self.columns_width:
temp_step = self.columns_width[j]
assert isinstance(temp_step, float), "Column width must be a float value"
assert 0 < temp_step <= 1, "Column width must be in range [0 < column_width <= 1]"
x_point = x_point + (distance * temp_step)
else:
x_point = x_point + (distance / self.column_count)
y_point -= y_step
lines = VGroup(*lines)
return lines
class CustomersTable(Table):
"""Overridden Table class. Custom text and dots were added."""
def __init__(
self,
start_end_points: Tuple[tuple, tuple],
row_count: int = 0,
row_height: Union[int, float] = 0.5,
visible_row_count: int = 0,
colors: list = None,
bins: Union[int, float] = 0,
text: str = "",
start_dots_values: list = None,
):
"""Class initialization.
Args:
start_end_points (Tuple[tuple, tuple]): Left top and right top points. ((x1,y1), (x2,y2)).
row_count (int, optional): Table row count. Defaults to 0.
row_height (Union[int, float], optional): Table row height. Defaults to 0.2.
visible_row_count (int, optional): Table visible row count. Defaults to 0.
colors (list, optional): List with dot colors. Defaults to None.
bins (Union[int, float], optional): Count of possible dots values.
Defaults to 0.
text (str, optional): Text for adding to the table. Ex "Customer"
Defaults to "".
start_dots_values (list, optional): List with initial values for the dots.
Defaults to None.
"""
self.horizontal_line = [
ShapePoint(start_end_points[0]),
ShapePoint(start_end_points[1]),
]
self.colors = colors or list()
self.bins = bins
column_count = 2
columns_width = (0.8, 0.2)
self.text = text
self.text_scale = 0.6
self.start_dots_values = start_dots_values
self.default_color = "red"
self.customers, self.dots = self._add_dots_and_customers_to_table(
row_count=row_count,
row_height=row_height,
columns_width=columns_width,
)
super().__init__(
start_end_points,
row_count,
row_height,
column_count,
visible_row_count,
columns_width,
BLACK,
1,
*self.customers,
*self.dots,
)
def _add_dots_and_customers_to_table(
self,
row_height: Union[int, float],
row_count: int,
columns_width: Tuple,
) -> Tuple[VGroup, VGroup]:
"""Method for creating dots and texts.
Args:
row_height (Union[int, float]): Table rows height.
row_count (int): Table rows count.
columns_width (Tuple): Table rows width.
Returns:
Tuple[VGroup, VGroup]: Tuple with all dots and texts.
"""
customers = []
dots = []
y_point = self.horizontal_line[0][1]
y_step = row_height
x_left_point = self.horizontal_line[0][0]
x_right_point = self.horizontal_line[1][0]
distance = abs(x_right_point - x_left_point)
step_x = distance * columns_width[0]
# Adding texts and dots
for i in range(row_count):
# Adding text to the table
customer = HistogramText(
f"{self.text} {i+1}",
color=BLACK,
)
# Changing text size
customer.scale(self.text_scale)
# Moving text to the table cell
customer.move_to(
array([x_left_point + 0.2, y_point - (y_step / 2), 0]),
aligned_edge=LEFT_SIDE, # Aligning it at the left side of the cell
)
customers.append(customer)
# Forcing to generate always the same numbers
random.seed(i + 1)
# Adding dot value
if self.start_dots_values and i < len(self.start_dots_values):
dot_value = self.start_dots_values
else:
if isinstance(self.bins, int):
dot_value = random.randrange(1, self.bins + 1)
else:
dot_value = round(random.uniform(1.0, self.bins + 1.0), 1)
if len(self.colors) < dot_value:
dot_color = self.default_color
else:
dot_color = self.colors[int(dot_value) - 1]
# Adding dot
dot = HistogramDot(
value=dot_value,
point=array([x_left_point + step_x + 0.3, y_point - (y_step / 2), 0]),
color=dot_color,
)
dots.append(dot)
y_point -= y_step
customers = VGroup(*customers)
dots = VGroup(*dots)
return customers, dots
Выносим всю кастомизацию в классы — получаем читабельный код
Вы спросите — зачем же столько кода, ужасное ООП, куча наследования и так далее? Всё просто: чтобы спрятать ненужную шелуху в классы. Тогда код будет выглядеть максимально читабельным и красивым. Давайте посмотрим, что можно сделать с уже написанным.
Создадим новый метод play_second_scene в классе Scenario. Добавим таблицу: укажем координаты, общее количество строк, количество строк, которое будет видно на экране, и количество корзин в таблице. Добавим метод scene.play, в котором вызовем метод появления таблицы. В файле main.py в методе construct заменим hist.play_first_scene() на hist.play_second_scene().
После этого запускаем рендер видео из консоли с помощью команды
> poetry run python main.py
… и наслаждаемся видом нашей таблицы покупателей:
scenario.py
def play_second_scene(self):
table = CustomersTable(
((-2, 2), (2, 2)),
row_count=10,
visible_row_count=10,
bins=2,
)
self.scene.play(FadeIn(table))
self.scene.wait(3)
Теперь у нас осталась всего одна инициализация таблицы и один вызов метода появления. Код чистый, красивый, с ним легко следить за сценарием видео, его легко поддерживать. Вся кастомизация вынесена в классы, и мы о ней вообще не задумываемся.
Пойдём дальше — таким же способом создадим классы для графика и воронки.
Строим график
Следующая задача — построение графика. Опишу его параметры:
- График может быть двух видов: дискретным и непрерывным.
- Графику нужно добавить возможность запоминать все координаты, на которые перемещаются шарики. Мы будем перемещать шарики из таблицы на график, и когда у нас появится два шарика с числом 3, они должны будут встать один над другим, выстроившись в столбик. То есть, чтобы расположить шарик на плоскости, нужно взять координаты предыдущего шарика, добавить к координате Y диаметр шарика и расположить новый шарик на новых координатах.
Небольшое пояснение к коду: во-первых, мы снова используем наследование. То есть создаём класс Graph и делаем его абстрактным. В этот класс добавляем общий для всех потомков метод _prepare_next_dot_coords и абстрактный метод _create_graph. От класса Graph наследуются два других класса: CategoricalGraph и ContinuousGraph. Во-вторых, благодаря питоническому Multiple Inheritance в классы-наследники добавляется VGroup, и на выходе получается новый объект, которым можно манипулировать (добавлять в сцену, удалять, перемещать и т. д.).
classes/graph.py
Теперь соберём всё в метод play_third_scene и запустим сборку, как в предыдущем варианте:
scenario.py
def play_third_scene(self):
cont_graph = ContinuousGraph(
((-4, -1), (0, -1)),
((-2, 1), (-2, -3)),
bins=4,
annot=False,
)
cat_graph = CategoricalGraph(
((0, 2), (4, 2)),
None,
bins=4,
annot=True,
)
self.scene.play(FadeIn(cont_graph), FadeIn(cat_graph))
self.scene.wait(3)
В итоге мы получили два графика: непрерывный и дискретный. У каждого своя логика отрисовки корзин и подписи:
Рисуем воронки
Осталось нарисовать только воронки. Как и объекты, которые мы создавали ранее, воронки представляют собой набор линий с определёнными координатами. Однако перед тем, как перейти к их созданию, вспомним изначальное видео и второй сценарий. Шарики должны падать именно в свою воронку, а не в какую-то другую, плюс не просто переноситься, а именно скатываться по горлышку воронки.
Также нам нужно, чтобы воронка была самостоятельным объектом. Это даст возможность строить столько воронок, сколько нужно. Мы напишем два класса: один для воронки, а второй для управления построением воронок. Звучит сложно, но здесь и начинается всё самое интересное!
classes/funnel.py
from typing import Tuple, Union
from colour import Color
from manimlib.imports import BLACK, Line, VGroup
from numpy import array, mean
from .histogram_text import HistogramText
from .shape_point import ShapePoint
class Funnel(VGroup):
text_scale: Union[int, float] = 0.6
def __init__(
self,
start_end_points: Tuple[tuple, tuple],
height: Union[int, float],
point_radius: Union[int, float],
annot: bool = False,
annot_text: str = "",
lines_color: Color = BLACK,
stroke_width: Union[int, float] = 1,
):
"""Funnel initialization.
Args:
start_end_points (Tuple[tuple, tuple]): Left top and right top points. ((x1,y1), (x2,y2)).
height (Union[int, float]): Funnel height.
point_radius (Union[int, float]): Point radius. With that value we could calculate the opening
of the funnel.
annot (bool, optional): Do we need to annotate the funnel or not. Defaults to False.
annot_text (str, optional): Text to annotate funnel. Defaults to "".
lines_color (Color, optional): Lines color for the funnel. Defaults to BLACK.
stroke_width (Union[int, float], optional): Line width for the funnel. Defaults to 1.
"""
self.left_top_point = ShapePoint(start_end_points[0])
self.right_top_point = ShapePoint(start_end_points[1])
self.height = height
self.point_radius = point_radius
self.point_diameter = point_radius * 1.5
self.lines_color = lines_color
self.stroke_width = stroke_width
self.annot = annot
self.annot_text = annot_text
self.y_point_top = self.left_top_point[1]
self.y_point_bottom = self.y_point_top - self.height
self.x_point_left = self.left_top_point[0]
self.x_point_right = self.right_top_point[0]
self.y_bottom_shift = 0.2
self.x_funnel_center = mean(array([self.right_top_point[0], self.left_top_point[0]]))
self.left_to_bottom = Line(
array([self.x_point_left, self.y_point_top, 0]),
array([self.x_point_left, self.y_point_bottom, 0]),
color=self.lines_color,
stroke_width=self.stroke_width,
)
self.left_to_bottom_right = Line(
array([self.x_point_left, self.y_point_top, 0]),
array([self.x_funnel_center - self.point_diameter, self.y_point_top - 0.5, 0]),
color=self.lines_color,
stroke_width=self.stroke_width,
)
self.right_to_bottom = Line(
array([self.x_point_right, self.y_point_top, 0]),
array([self.x_point_right, self.y_point_bottom, 0]),
color=self.lines_color,
stroke_width=self.stroke_width,
)
self.right_to_bottom_left = Line(
array([self.x_point_right, self.y_point_top, 0]),
array([self.x_funnel_center + self.point_diameter, self.y_point_top - 0.5, 0]),
color=self.lines_color,
stroke_width=self.stroke_width,
)
self.left_funnel_appendix = Line(
array([self.x_funnel_center + self.point_diameter, self.y_point_top - 0.5, 0]),
array([self.x_funnel_center + self.point_diameter, self.y_point_top - 0.7, 0]),
color=self.lines_color,
stroke_width=self.stroke_width,
)
self.right_funnel_appendix = Line(
array([self.x_funnel_center - self.point_diameter, self.y_point_top - 0.5, 0]),
array([self.x_funnel_center - self.point_diameter, self.y_point_top - 0.7, 0]),
color=self.lines_color,
stroke_width=self.stroke_width,
)
self.bottom_line = Line(
array([self.x_point_left - 0.2, self.y_point_bottom + self.y_bottom_shift, 0]),
array([self.x_point_right + 0.2, self.y_point_bottom + self.y_bottom_shift, 0]),
color=self.lines_color,
stroke_width=self.stroke_width,
)
texts = []
if annot:
text = HistogramText(annot_text, color=self.lines_color)
text.move_to(array([self.x_funnel_center, self.y_point_bottom, 0]))
text.scale(self.text_scale)
texts.append(text)
super().__init__(
self.left_to_bottom,
self.right_to_bottom,
self.left_to_bottom_right,
self.right_to_bottom_left,
self.left_funnel_appendix,
self.right_funnel_appendix,
self.bottom_line,
*texts,
)
Создадим четвёртую сцену, определив необходимые параметры для создания воронок, и запустим сборку:
scenario.py
def play_fourth_scene(self):
funnel = Funnel(
((-2, 2), (1, -2)),
height=4,
point_radius=0.2,
)
self.scene.play(
FadeIn(funnel),
)
self.scene.wait(3)
Теперь у нас появились красивые воронки, с которыми можно работать дальше:
Анимируем объекты
Итак, у нас есть воронки, графики, таблицы, шарики… Но мы пока что не сделали одну важную вещь — сейчас эти объекты статические. То есть мы их определили, отобразили и на этом всё. Нам же нужно, чтобы шарики могли взаимодействовать с остальными объектами, перемещаясь по ним.
По сценарию у нас есть таблица со списком покупателей, где напротив каждого покупателя нарисован шарик с количеством покупок (значение шарика). Для отображения количества покупок в виде гистограммы нужно создать график, вывести его на экран и затем перенести на него шарики так, чтобы каждому значению шарика соответствовало такое же значение на графике.
Для реализации этой логики создадим (ни за что не догадаетесь) класс! Назовем его Movable. Класс будет иметь собственный словарь _next_dot_coords, в котором лежат координаты всех точек, уже перенесённых на график, а также метод _get_next_dot_coords, который по значению шарика будет отдавать его координаты на графике и, наконец, метод drag_in_dots, отвечающий за «притяжение» к себе всех шариков.
Пояснение: есть таблица с шариками и график. Вызываем метод графика drag_in_dots, в который передаём шарики, находящиеся в данный момент в таблице. В цикле проходимся по шарикам, где для каждого шарика вызываем метод графика _get_next_dot_coords, который отдаёт новые координаты шарика, и перемещаем шарики на новые координаты. Готово.
И всё-таки совсем понятно станет после реализации. Давайте ей и займёмся:
classes/movable_graph.py
from abc import ABC
from copy import deepcopy
from typing import Dict, Union
from manimlib.imports import DEFAULT_ANIMATION_RUN_TIME, ApplyMethod, Scene, Transform, VGroup
from numpy import array, ndarray
from .graph import CategoricalGraph, ContinuousGraph
from .histogram_dot import HistogramDot
class Movable(ABC):
"""Abstract class to add 'movable' functionality to the graph"""
_next_dot_coords: Dict[Union[int, float], Dict[str, Union[int, float]]] = {}
dot_padding: Union[int, float] = 0
def __init__(self, *args, **kwargs):
self._next_dots_coords = self._prepare_next_dot_coords()
super().__init__(*args, **kwargs)
def _get_next_dot_coords(self, dot: HistogramDot) -> ndarray:
"""Getting points for dots to move.
Args:
dot (HistogramDot): Dot from which we will calculate current coordinates.
Returns:
array: Next dot location.
"""
current_coord = self._next_dots_coords.get(int(dot.value), {})
bin_center = array([current_coord.get("x", 0), current_coord.get("y", 0), 0])
self._next_dots_coords[int(dot.value)]["y"] = current_coord.get("y", 0) + dot.radius + self.dot_padding
return bin_center
def drag_in_dots(
self,
scene: Scene,
dots: VGroup,
animate_slow: int,
animate_rest: bool,
run_time: Union[int, float] = None,
delay: Union[int, float] = None,
):
"""Moving dots to the graph.
Args:
scene (Scene): Scene where all our objects are located.
dots (VGroup): List of dots to move.
animate_slow (int): How many dots do we need to animate slowly.
animate_rest (bool): Do we need to move the rest of the dots or not.
run_time (Union[int, float]): How quickly we need to animate dots. Defaults to None.
delay (Union[int, float], optional): Delay between animations. Defaults to None.
"""
if not run_time:
run_time = DEFAULT_ANIMATION_RUN_TIME
for dot in dots[:animate_slow]:
scene.play(
ApplyMethod(dot.move_to, self._get_next_dot_coords(dot)),
run_time=run_time,
)
if delay:
scene.wait(delay)
if animate_rest:
dots_rest = deepcopy(dots[animate_slow:])
for dot in dots_rest:
dot.move_to(self._get_next_dot_coords(dot))
scene.play(Transform(dots[animate_slow:], dots_rest))
scene.remove(dots[animate_slow:])
else:
for dot in dots[animate_slow:]:
dot.move_to(self._get_next_dot_coords(dot))
class MovableContinuousGraph(ContinuousGraph, Movable):
"""Continuous graph that could move dots"""
class MovableCategoricalGraph(CategoricalGraph, Movable):
"""Categorical graph that could move dots"""
Теперь создадим видео по первому сценарию: выведем на экран таблицу с шариками, затем график и переместим на него шарики из таблицы.
scenario.py
def play_fifth_scene(self):
# Initial dot values, to keep them the same over several animation builds
start_dot_values = [1, 2, 1, 3, 4, 2, 1]
# Table initialization
table = CustomersTable(
((-6, 2), (-2, 2)),
row_count=10,
visible_row_count=10,
bins=4,
start_dots_values=start_dot_values,
)
# Graph initialization
x_graph = MovableCategoricalGraph(
((0, 0), (4, 0)),
None,
bins=4,
annot=True,
)
# Playing animation for the table and graph appearing
self.scene.play(FadeIn(table), FadeIn(x_graph))
self.scene.wait(2)
# Moving dots from the table to the graph
x_graph.drag_in_dots(self.scene, dots=table.dots, animate_slow=3, animate_rest=True)
self.scene.wait(3)
После сборки получим такую прекрасную анимацию:
Всё здорово, остался последний элемент — воронки тоже нужно сделать динамическими. Movable-воронкам для перемещения шариков не подойдёт простой drag_in, потому что метод должен определять, к какой воронке относится шарик, а после отрисовывать, как шарик скатывается по ней внутрь. Звучит интересно, давайте попробуем реализовать.
Во время создания воронок класс Funnel запоминает все линии с координатами. То есть мы легко можем сравнить их с координатами шарика, который должен упасть в воронку.
Весь алгоритм состоит из следующих пунктов:
- Вызвать метод drag_in_dots, который запустит цикл обработки шариков.
- Для каждого шарика вызвать метод _get_next_dot_coords.
- В методе _get_next_dot_coords для каждого шарика нужно:
- получить координаты текущего шарика;
- получить координаты левой и правой «крыши»;
- получить координаты центра воронки.
После нахождения координат рассчитываем три точки, куда должен упасть шарик:
Ну а дальше самое интересное. Для перемещения шарика из точки 0 в точку 1 нужно знать X и Y точки 1. X мы знаем — он такой же, как и у шарика. А вот точку Y придётся высчитывать. У нас есть координаты начала и конца линии, на которую будет падать шарик, соответственно, мы можем рассчитать X для точки падения. Однако вручную делать это не нужно.
point_x = dot.get_x()
first_point = None
second_point = None
# Looking for the Line for Dot to move (fall)
if self.x_point_left <= point_x <= x_left_to_bottom_right:
line = self.left_to_bottom_right
elif x_right_to_bottom_left <= point_x <= self.x_point_right:
line = self.right_to_bottom_left
elif x_left_to_bottom_right < point_x < x_right_to_bottom_left:
line = None
else:
return None, None, None
if line is not None:
# Getting all X, Y points from the line
line_x = [x[0] for x in line.get_all_points()]
line_y = [x[1] for x in line.get_all_points()]
# Where the magic happens. We're interpolating Y from other X, Y points.
point_y = interp(point_x, line_x, line_y, period=10)
point_y += 0.25
first_point = array([point_x, point_y, 0])
second_point = array([self.x_funnel_center, funnel_center_y, 0])
third_point = array([self.x_funnel_center, current_coord, 0])
Полный код класса MovableFunnel:
classes/movalbe_funnel.py
from copy import deepcopy
from typing import Dict, Tuple, Union
from manimlib.imports import ApplyMethod, Scene, Transform, VGroup
from numpy import array, interp
from .funnel import Funnel
from .histogram_dot import HistogramDot
class MovableFunnelException(Exception):
pass
class LineNotFoundException(MovableFunnelException):
pass
class MovableFunnel(Funnel):
"""Overridden Funnel class to add 'movable' functionality"""
_next_dot_coords: Dict[str, Union[int, float]] = {}
dot_padding: Union[int, float] = 0.22
animated_slowly: int = None
def __init__(
self,
start_end_points: Tuple[tuple, tuple],
run_time: Union[int, float],
*args,
**kwargs,
):
"""Class initialization. It receives all parameters that the Funnel class needs.
Args:
start_end_points (Tuple[tuple, tuple]): Left top and right top points. ((x1,y1), (x2,y2)).
run_time (Union[int, float]): How quickly we need to animate dots.
"""
self.run_time = run_time
super().__init__(start_end_points, *args, **kwargs)
self._next_dots_coords = {
"x": self.x_funnel_center,
"y": self.y_point_bottom + (self.y_bottom_shift * 2),
}
def _get_next_dots_coords(
self, dot: HistogramDot
) -> Union[Tuple[array, array, array], Tuple[None, None, array], Tuple[None, None, None]]:
"""Getting points for dots to move.
Args:
dot (HistogramDot): Dot from which we will calculate current coordinates.
Returns:
Union[
Tuple[array, array, array],
Tuple[None, None, array],
Tuple[None, None, None,]
]: Tuple with the points for the next dot move (fall).
"""
# Getting all needed coordinates of the funnel
current_coord = self._next_dots_coords.get("y")
x_left_to_bottom_right = self.left_to_bottom_right.get_all_points()[-1][0]
x_right_to_bottom_left = self.right_to_bottom_left.get_all_points()[-1][0]
funnel_center_y = self.left_to_bottom_right.get_all_points()[-1][1] + 0.1
point_x = dot.get_x()
first_point = None
second_point = None
# Looking for the Line for Dot to move (fall)
if self.x_point_left <= point_x <= x_left_to_bottom_right:
line = self.left_to_bottom_right
elif x_right_to_bottom_left <= point_x <= self.x_point_right:
line = self.right_to_bottom_left
elif x_left_to_bottom_right < point_x < x_right_to_bottom_left:
line = None
else:
return None, None, None
if line is not None:
# Getting all X, Y points from the line
line_x = [x[0] for x in line.get_all_points()]
line_y = [x[1] for x in line.get_all_points()]
# Where the magic happens. We're interpolating Y from other X, Y points.
point_y = interp(point_x, line_x, line_y, period=10)
point_y += 0.25
first_point = array([point_x, point_y, 0])
second_point = array([self.x_funnel_center, funnel_center_y, 0])
third_point = array([self.x_funnel_center, current_coord, 0])
# Remembering current position
self._next_dots_coords["y"] = current_coord + dot.radius + self.dot_padding
return first_point, second_point, third_point
def drag_in_dots(self, scene: Scene, dots: VGroup, animate_slow: int, animate_rest: bool):
"""Moving dots from anywhere to the funnel.
Args:
scene (Scene): Scene where all our objects are located.
dots (VGroup): List of dots to move.
animate_slow (int): How many dots do we need to animate slowly.
animate_rest (bool): Do we need to move the rest of the dots or not.
"""
if animate_slow > len(dots):
animate_slow = len(dots)
animated_slowly = 0
for dot in dots[:animate_slow]:
first_point, second_point, third_point = self._get_next_dots_coords(dot)
if all(x is None for x in (first_point, second_point, third_point)):
continue
if first_point is not None:
scene.play(ApplyMethod(dot.move_to, first_point), run_time=self.run_time)
scene.play(ApplyMethod(dot.move_to, second_point), run_time=self.run_time)
scene.play(ApplyMethod(dot.move_to, third_point), run_time=self.run_time)
animated_slowly += 1
dots_rest = deepcopy(dots[animate_slow:])
for dot in dots_rest:
*_, third_point = self._get_next_dots_coords(dot)
if third_point is None:
continue
dot.move_to(third_point)
if dots_rest:
if animate_rest:
scene.play(Transform(dots[animate_slow:], dots_rest))
else:
scene.add(dots_rest)
scene.remove(dots_rest)
self.animated_slowly = animated_slowly
Последний класс на сегодня — Funnels — нужен для создания нескольких воронок сразу, а также чтобы вызвать метод drag_in_dots для каждой из них.
Получаем крайние точки воронок в методе init, делим расстояние на количество воронок, а затем в цикле добавляем готовые объекты Funnel. Для метода drag_in_dots добавляем расчет параметра animmate_slow, чтобы анимировать падение в начале анимации, а не отдельно для каждой воронки.
classes/funnels.py
from typing import List, Tuple, Union
from manimlib.imports import Scene, VGroup
from classes.movable_funnel import MovableFunnel
from .funnel import Funnel
from .shape_point import ShapePoint
class FunnelsExeption(Exception):
"""General exception for Funnels class"""
class Funnels(VGroup):
funnels: List[Funnel] = []
def __init__(
self,
start_end_points: Tuple[tuple, tuple],
funnel: Funnel,
count: int,
bins: Union[int, float],
annot: bool = False,
*args,
**kwargs,
):
"""Object-constructor for the funnels. Inside init, you could pass all needed variables that will be
passed to the Funnel init as well.
Args:
start_end_points (Tuple[tuple, tuple]): Left top and right top points. ((x1,y1), (x2,y2)).
funnel (Funnel): Class for funnel building. Must be inherited from Funnel.
count (int): Funnels count.
bins (Union[int, float]): Bins count for funnels.
annot (bool, optional): Annotate funnels or not. Defaults to False.
Example:
funnels = Funnels(
start_end_points=((-6.5, -4), (6.5, -4)),
funnel=MovableFunnel,
count=5,
bins=bins,
annot=True,
point_radius=0.2,
run_time=0.8,
height=4,
)
"""
self.left_top_point = ShapePoint(start_end_points[0])
self.right_top_point = ShapePoint(start_end_points[1])
self.bins = bins
self.count = count
step = abs((self.right_top_point[0] - self.left_top_point[0]) / count)
x_start_point = self.left_top_point[0]
x_end_point = x_start_point + step
y_point = self.left_top_point[1]
# Creating list for the annotation texts
annot_step = int(self.bins / self.count)
annot_bins = [i for i in range(0, int(self.bins) + annot_step, annot_step)]
annots = [f"{x+1}–{y}" for x, y in zip(annot_bins[:-1], annot_bins[1:])]
# Creating funnels in cycle
for i in range(self.count):
self.funnels.append(
funnel(
*args,
start_end_points=(
(x_start_point, y_point),
(x_end_point, y_point),
),
annot=annot,
annot_text=annots,
**kwargs,
)
)
x_start_point, x_end_point = x_end_point, x_end_point + step
super().__init__(*self.funnels)
def drag_in_dots(self, scene: Scene, dots: VGroup, animate_slow: int, animate_rest: bool):
"""Method for moving dots into funnels. Calls the same method drag_in_dots for every funnel
in self.funnels.
Args:
scene (Scene): Scene class.
dots (VGroup): Dots that we need to move.
animate_slow (int): How many dots we need to animate slowly.
animate_rest (bool): Do we need to move the rest of the dots or not.
Raises:
FunnelsExeption: Raises when funnels were not created with MovableFunnel class.
"""
if any(not isinstance(x, MovableFunnel) for x in self.funnels):
raise FunnelsExeption('method "drag_in_dots" allowed only for "MovableFunnel"')
# We are sorting dots ascending to be able to play animation from the smallest dot to the biggest.
_dots = VGroup(*sorted(dots, key=lambda x: x.value))
for funnel in self.funnels:
funnel.drag_in_dots(
scene=scene,
dots=_dots,
animate_slow=animate_slow,
animate_rest=animate_rest,
)
animate_slow = animate_slow - funnel.animated_slowly
Запустим сборку проекта, добавив новый сценарий, и посмотрим, как всё работает:
scenario.py
def play_sixth_scene(self):
bins = 100
funnels = Funnels(
start_end_points=((-6.5, 0), (6.5, 0)),
funnel=MovableFunnel,
count=5,
bins=bins,
annot=True,
point_radius=0.2,
run_time=0.8,
height=3,
)
start_dot_values = [1, 2, 1, 3, 4, 2, 1]
table = CustomersTable(
((-5, 2), (-1, 2)),
row_count=3,
visible_row_count=3,
bins=4,
start_dots_values=start_dot_values,
)
self.scene.add(funnels, table)
funnels.drag_in_dots(
scene=self.scene,
dots=table.dots,
animate_slow=3,
animate_rest=False,
)
Создаём финальное видео
Давайте наконец соединим всё то, что мы уже сделали, чтобы получить результат — видео по сценарию номер два. Алгоритм будет таким:
- рисуем таблицу с шариками,
- рисуем график,
- перемещаем шарики из таблицы на график,
- убираем таблицу с экрана,
- растягиваем график на весь экран (технически — рисуем второй график и трансформируем график 1 в график 2),
- перемещаем график наверх экрана (технически идёт перемещение экрана вниз),
- рисуем воронки,
- перемещаем шарики из графика в воронки.
classes/scenario.py
def play_whole_scenario(self):
# Dot bins maximum value
bins = 100
# Adding dot colors (from green to red)
dot_colors = list(Color("#7fcc81").range_to("#ff7555", int(bins)))
# Initial dot values, to keep them the same over several animation builds
start_dots_values = [31, 25, 63, 47, 82, 25, 49, 99, 21, 33, 37]
# Custom text for the table (Customer/buyer)
table_text = "Заказчик"
# Table initialization
table = CustomersTable(
((-6.5, 3), (-2.5, 3)),
row_count=30,
visible_row_count=11,
bins=bins,
colors=dot_colors,
start_dots_values=start_dots_values,
text=table_text,
)
# Graph initialization
x_graph = MovableContinuousGraph(
((-2, -3), (6.5, -3)),
None,
bins=bins,
annot=True,
)
# New graph that will be on the whole screen width
x_graph_second_position = MovableContinuousGraph(
((-6.5, -3), (6.5, -3)),
None,
bins=bins,
annot=True,
)
# Copying dots. This is for future needs.
dots_second_position = deepcopy(table.dots)
# Playing animations
self.scene.play(FadeIn(table), FadeIn(x_graph))
self.scene.wait(2)
# Moving dots from the table to the graph
x_graph.drag_in_dots(
self.scene,
dots=table.dots,
animate_slow=3,
animate_rest=True,
)
self.scene.wait(3)
# Removing graph
self.scene.play(FadeOut(table.lines), FadeOut(table.customers))
# Moving dots from the first graph to the second
x_graph_second_position.drag_in_dots(
scene=self.scene,
dots=dots_second_position,
animate_slow=0,
animate_rest=False,
)
# Playing animation with moving graphs from position 1 to position 2, and same for the dots.
self.scene.play(
Transform(x_graph, x_graph_second_position),
Transform(table.dots, dots_second_position),
)
self.scene.wait(3)
# Adding funnels
funnels = Funnels(
start_end_points=((-6.5, -4), (6.5, -4)),
funnel=MovableFunnel,
count=5,
bins=bins,
annot=True,
point_radius=0.2,
run_time=0.8,
height=4,
)
# Adding funnels to the screen
self.scene.add(funnels)
# Moving camera to the bottom
self.scene.play(self.scene.camera_frame.move_to, array([0, -5.5, 0]))
self.scene.wait(1)
# Moving dots from the graph to the funnels
funnels.drag_in_dots(
scene=self.scene,
dots=table.dots,
animate_slow=9,
animate_rest=True,
)
self.scene.wait(3)
# Removing all objects from scene
self.scene.play(
FadeOut(funnels),
FadeOut(table.dots),
FadeOut(x_graph),
FadeOut(x_graph_second_position),
)
# Moving scene back to center
self.scene.play(self.scene.camera_frame.move_to, array([0, 0, 0]))
self.scene.wait(1)
В main.py меняем вызов предыдущего сценария на play_whole_scenario, запускаем рендер и получаем видео:
Вуаля!
Создаём анимационные обучающие видео на Python с помощью Manim
Привет! Меня зовут Константин Мохов, я тимлид, который однажды прошёл курс Практикума по аналитике данных, по большей части для собственного развития. Тема создания анимированных видео на Python...
habr.com